Analytics
SeaChat Analytics Dashboards
Overview
SeaChat provides two comprehensive analytics dashboards to help you monitor and optimize your AI agent performance:
-
AI Agent Analytics Dashboard - Provides detailed insights into individual AI agent performance, including conversations, activity trends, label usage, and customer satisfaction metrics.
-
Workspace Analytics Dashboard - Offers an organization-wide view of all AI agents, conversations, and team performance metrics across your entire workspace.
Both dashboards enable you to track key performance metrics over time, measure engagement, optimize AI agent responses, and make data-driven decisions. Navigate to the Analytics tab below Agent Configuration to view the analytics for a specific AI agent, or access the Workspace Analytics from your workspace dashboard.
Key Features
📊 Track Performance - Monitor conversations, unique visitors, and message activity across all channels
📈 Measure Trends - Compare data across different time ranges to identify usage patterns and growth
🏷️ Label Analytics - Analyze how labels are used and related to understand conversation categories
🤖 Optimize Responses - Track AI agent vs human agent performance to improve automation
⭐ Customer Satisfaction - Monitor CSAT ratings and feedback to improve service quality
📅 Yearly Insights - View complete annual performance metrics and seasonal patterns
Analytics Sections
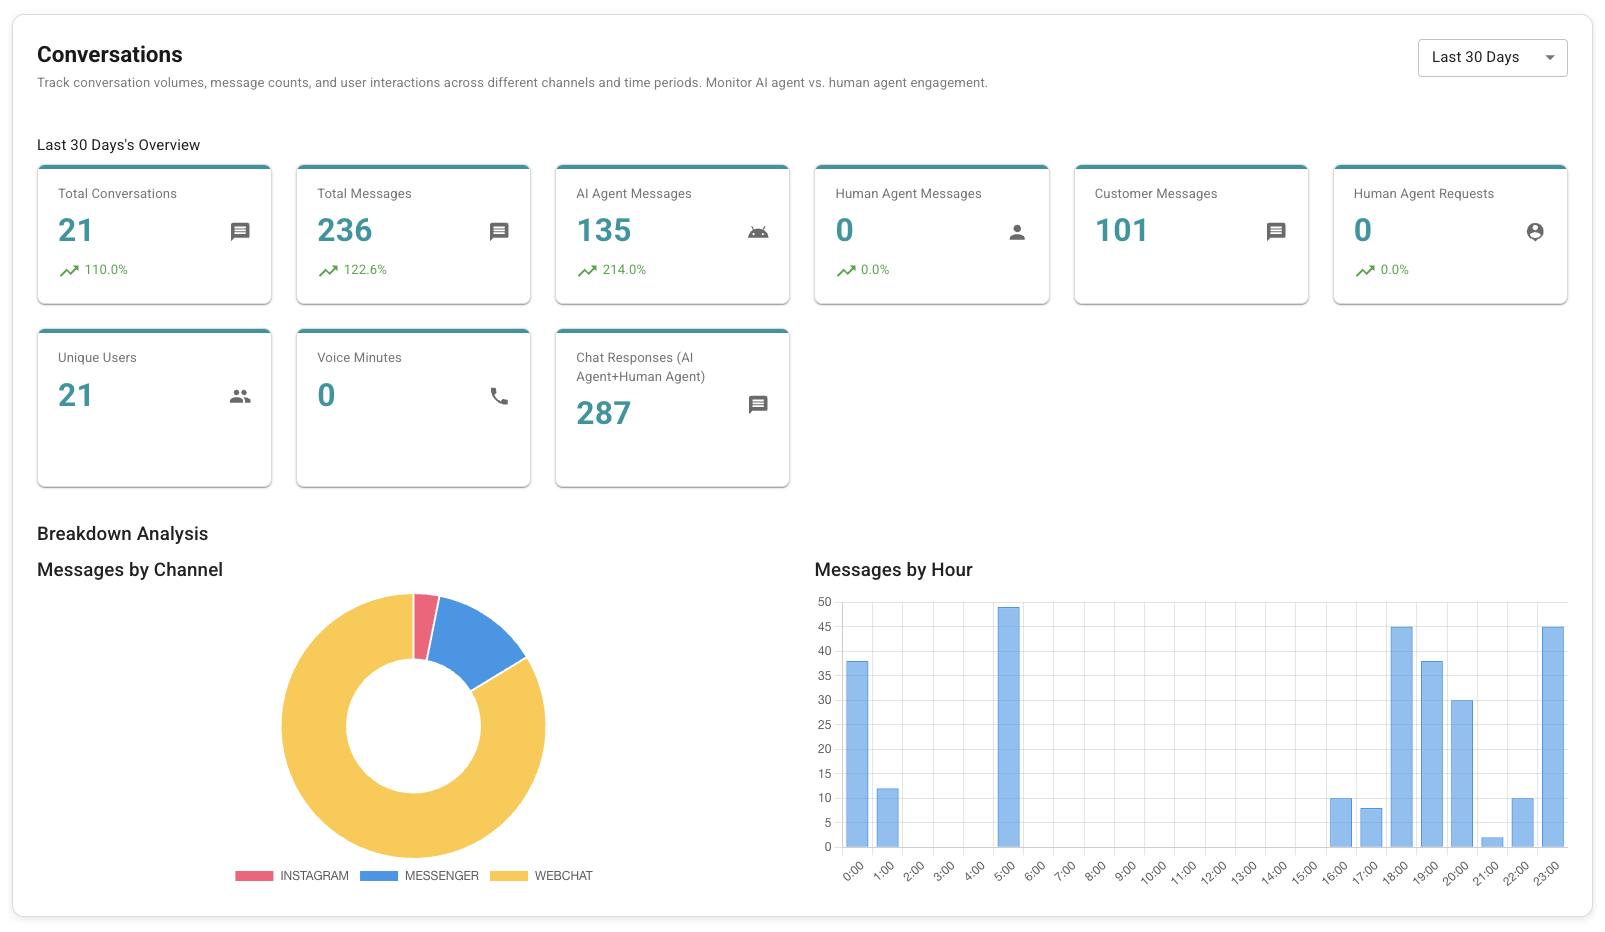
1. Conversations Section
Track conversation volumes, message counts, and user interactions across different channels and time periods. Monitor AI agent vs. human agent engagement to optimize your support strategy.
Conversations Analytics Dashboard
Key metrics include:
- Total conversations
- Message volumes and trends
- User engagement patterns
- AI agent vs human agent distribution
- Channel performance comparison
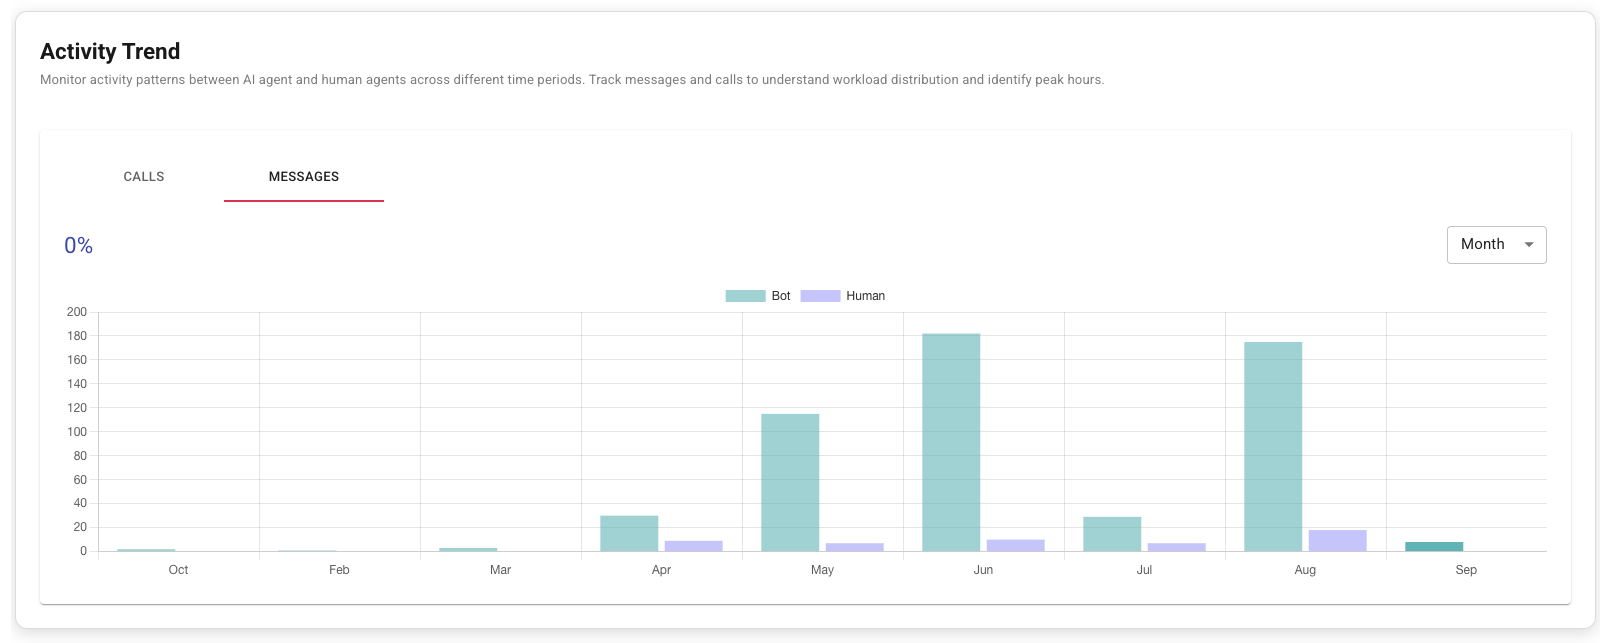
2. Activity Trend Section
Monitor activity patterns between AI agents and human agents across different time periods. Track messages and calls to understand workload distribution and identify peak hours.
Activity Trend Analysis
Features include:
- Calls and Messages Tabs - Switch between viewing call activity or message activity
- Time Unit Selection - Choose to view trends by day, month, or year
- Agent Comparison - Compare AI agent vs human agent activity levels
- Peak Hour Identification - Identify busy periods for better resource planning
3. Label Usage Overview
Get insights into how many conversations each label is attached to, helping you understand the categorization of your customer interactions.
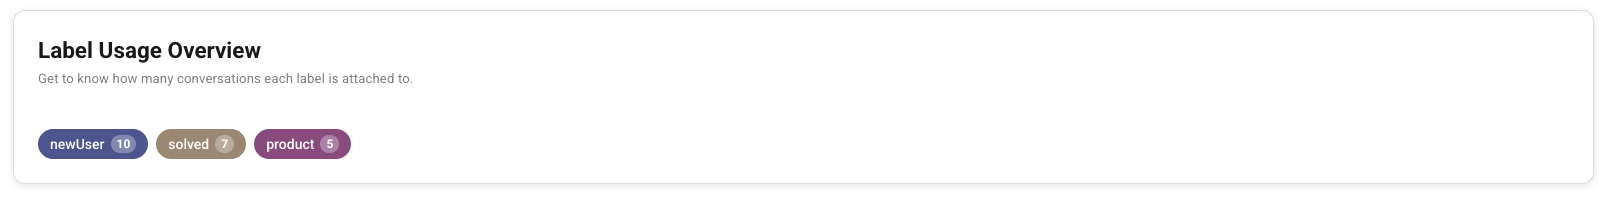
Label Usage Overview
This section shows total conversations per label
4. Label Usage by Period
Analyze how label usage changes over time with detailed breakdowns by day, month, or year. Track label trends and identify patterns in conversation categorization.
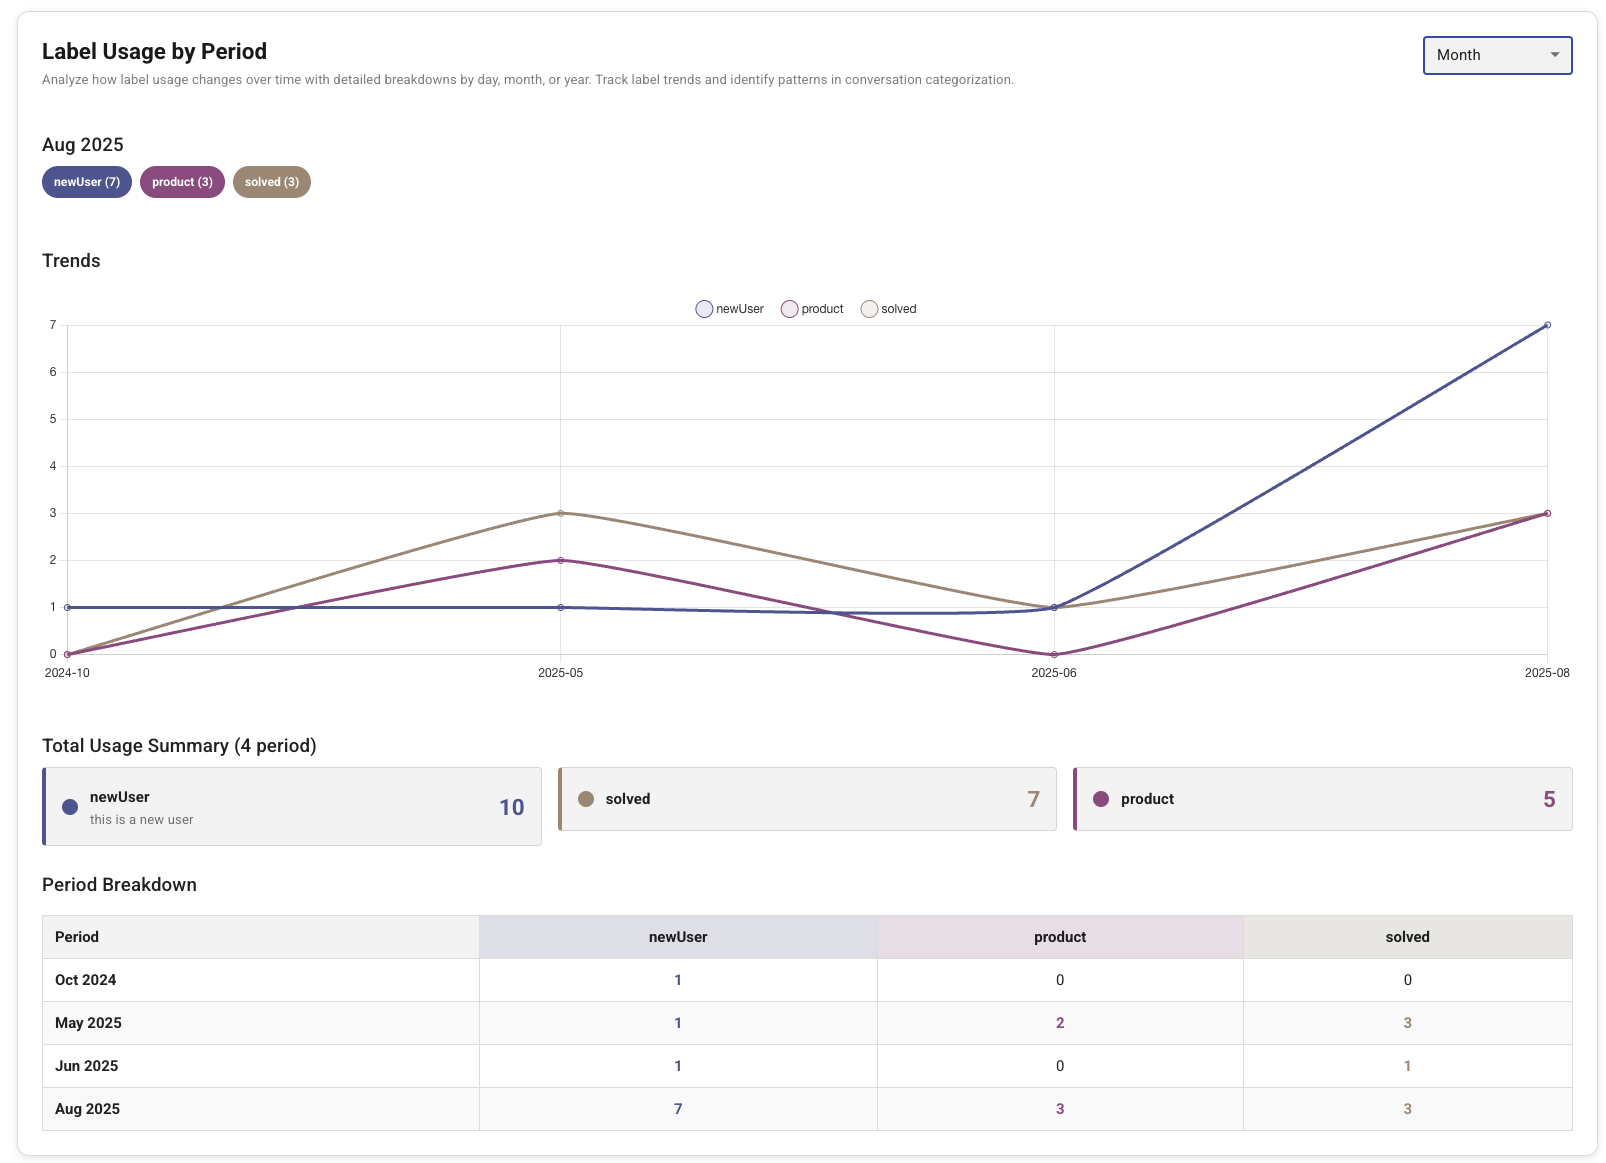
Label Usage Trends Over Time
Capabilities include:
- Time-based label trend analysis
- Comparison of label usage patterns
- Identification of seasonal or recurring issues
- Data export for deeper analysis
5. Label Relationship Analysis
Analyze how different labels appear together in conversations. Select two labels to discover overlap patterns, co-occurrence rates, and relationship insights for better label organization.
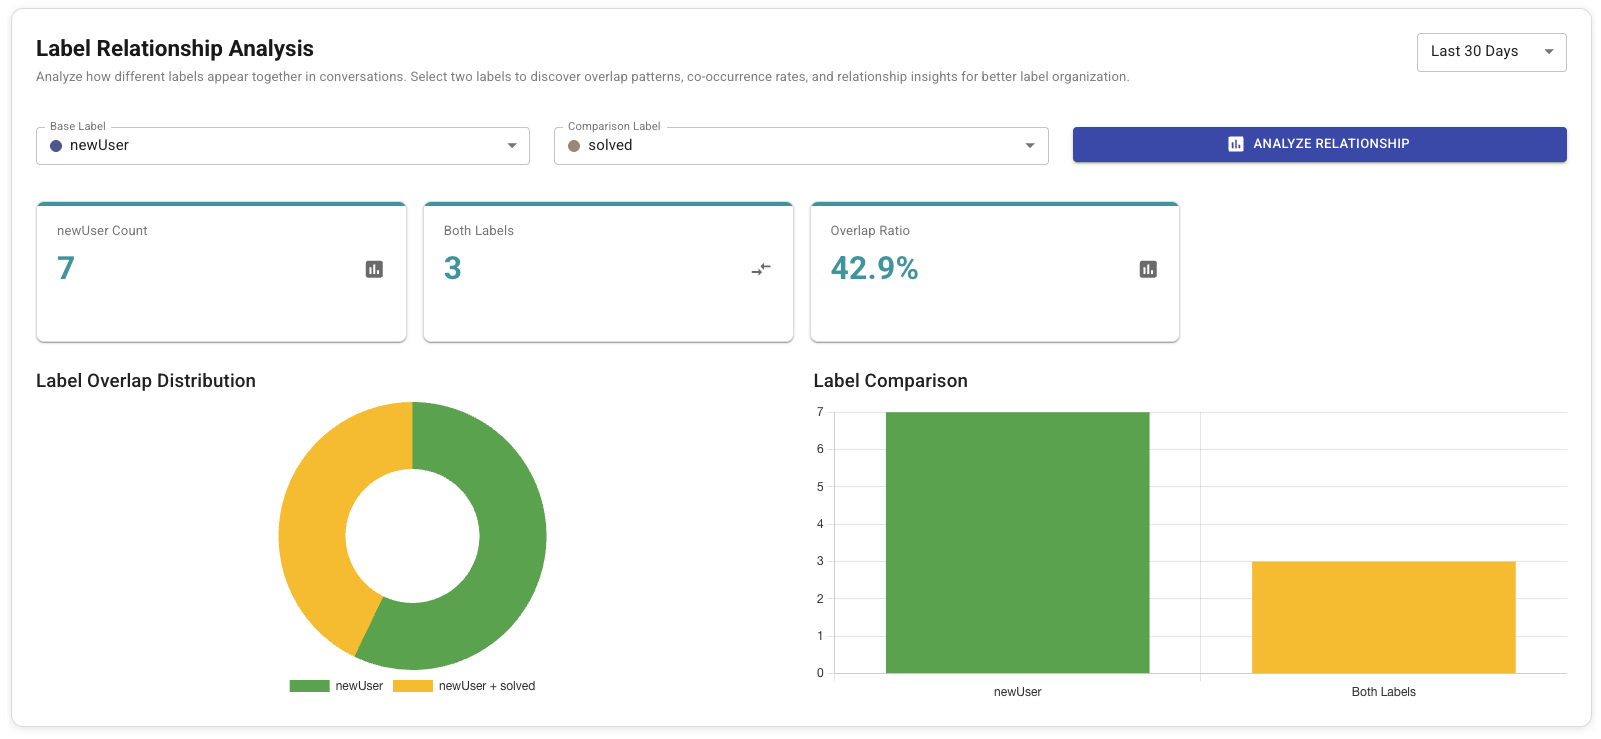
Label Relationship Analysis - Example: New User and Solved Labels
This analysis helps you:
- Understand label co-occurrences
- Identify related conversation topics
- Optimize label taxonomy
- Discover hidden patterns in customer interactions
6. Customer Satisfaction (CSAT)
Note: This section is only available in the AI Agent Analytics Dashboard as CSAT ratings are specific to each AI agent.
Track customer satisfaction through star ratings and feedback comments. Monitor satisfaction rates, rating distributions, and recent customer feedback to improve service quality. Link to the conversation for each comment.
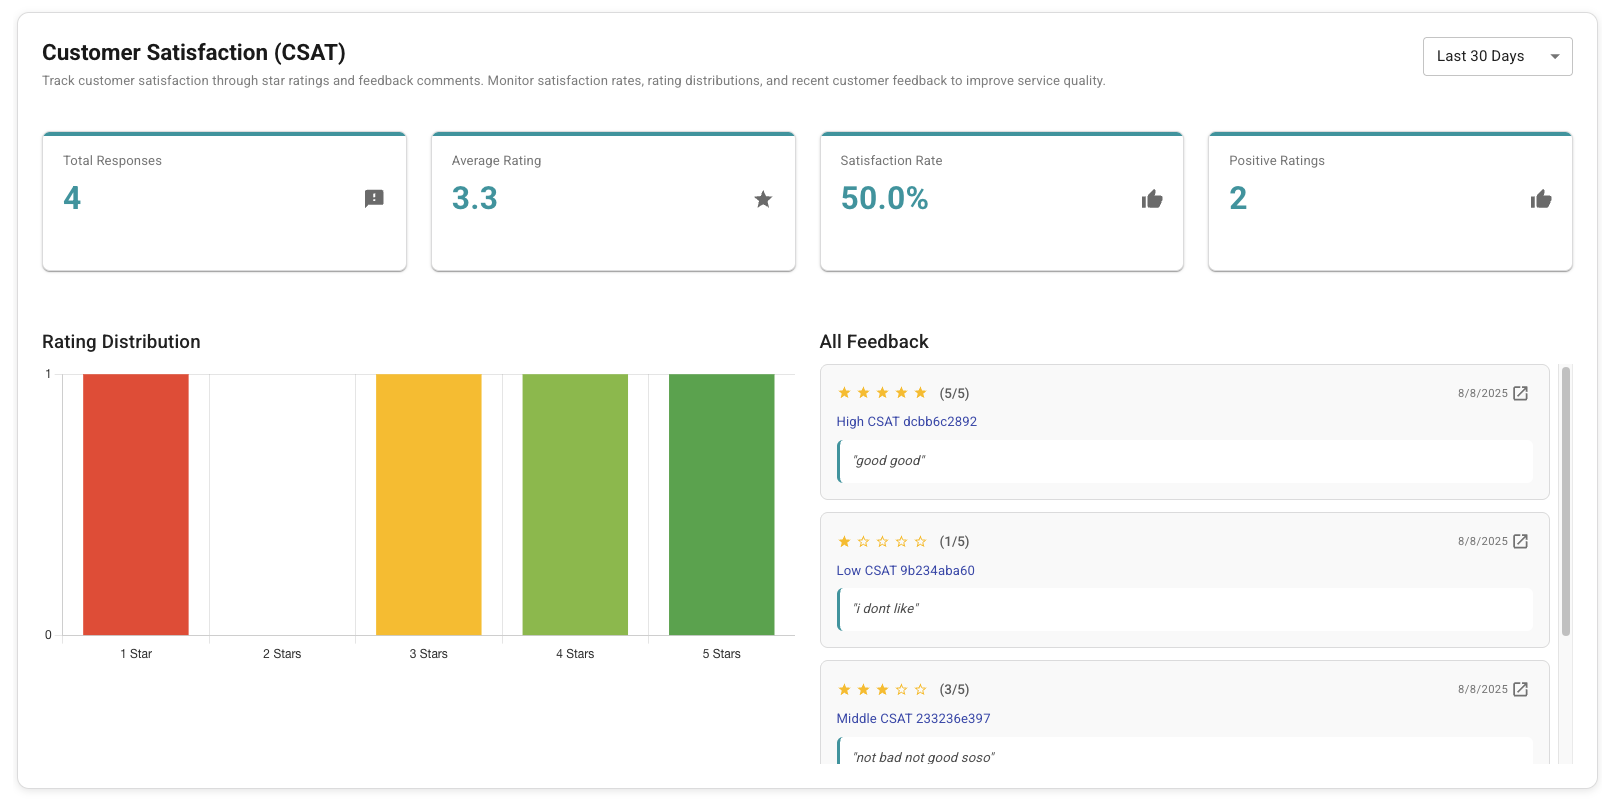
Customer Satisfaction Analytics
CSAT metrics include:
- Overall satisfaction score
- Rating distribution (1-5 stars)
- Recent feedback comments
- Satisfaction trends over time
- Channel-specific satisfaction rates
7. Yearly Overview
View your complete yearly performance metrics including total conversations, messages, and monthly trends to understand your annual growth and seasonality patterns.
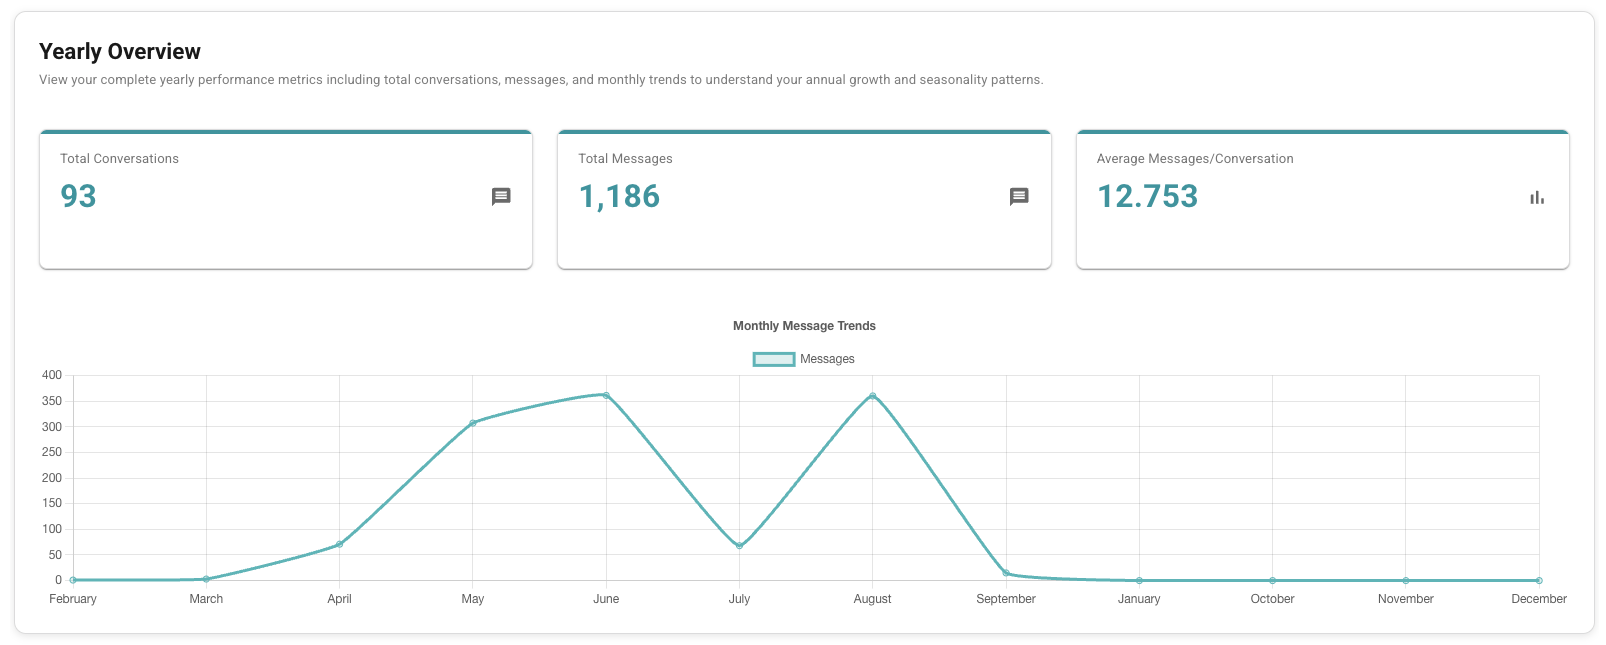
Yearly Performance Overview
Annual insights include:
- Total yearly conversations
- Average messages per conversation
- Monthly trend visualization
- Year-over-year comparisons
- Seasonal pattern identification
- Growth metrics and milestones
Time Zone Configuration
Select your preferred timezone for data presentation to ensure accurate time-based analytics.
Best Practices
- Regular Monitoring - Check your analytics dashboards weekly to stay informed about trends
- Label Consistency - Use consistent labeling to get meaningful insights from label analytics
- CSAT Follow-up - Act on customer feedback promptly to improve satisfaction scores
- Peak Hour Planning - Use activity trends to schedule human agents during busy periods
- Channel Optimization - Focus resources on high-performing channels based on conversation data