Insights Dashboard: Voicebot Monitor
🔎 Important Note: Invite-Only Access
The Insights Dashboard is currently an exclusive, invite-only feature. If you would like to access this dashboard, please contact us at info@seasalt.ai. Our team will be happy to enable the permissions for your workspace!
Welcome to Seasalt Voicebot Monitor!
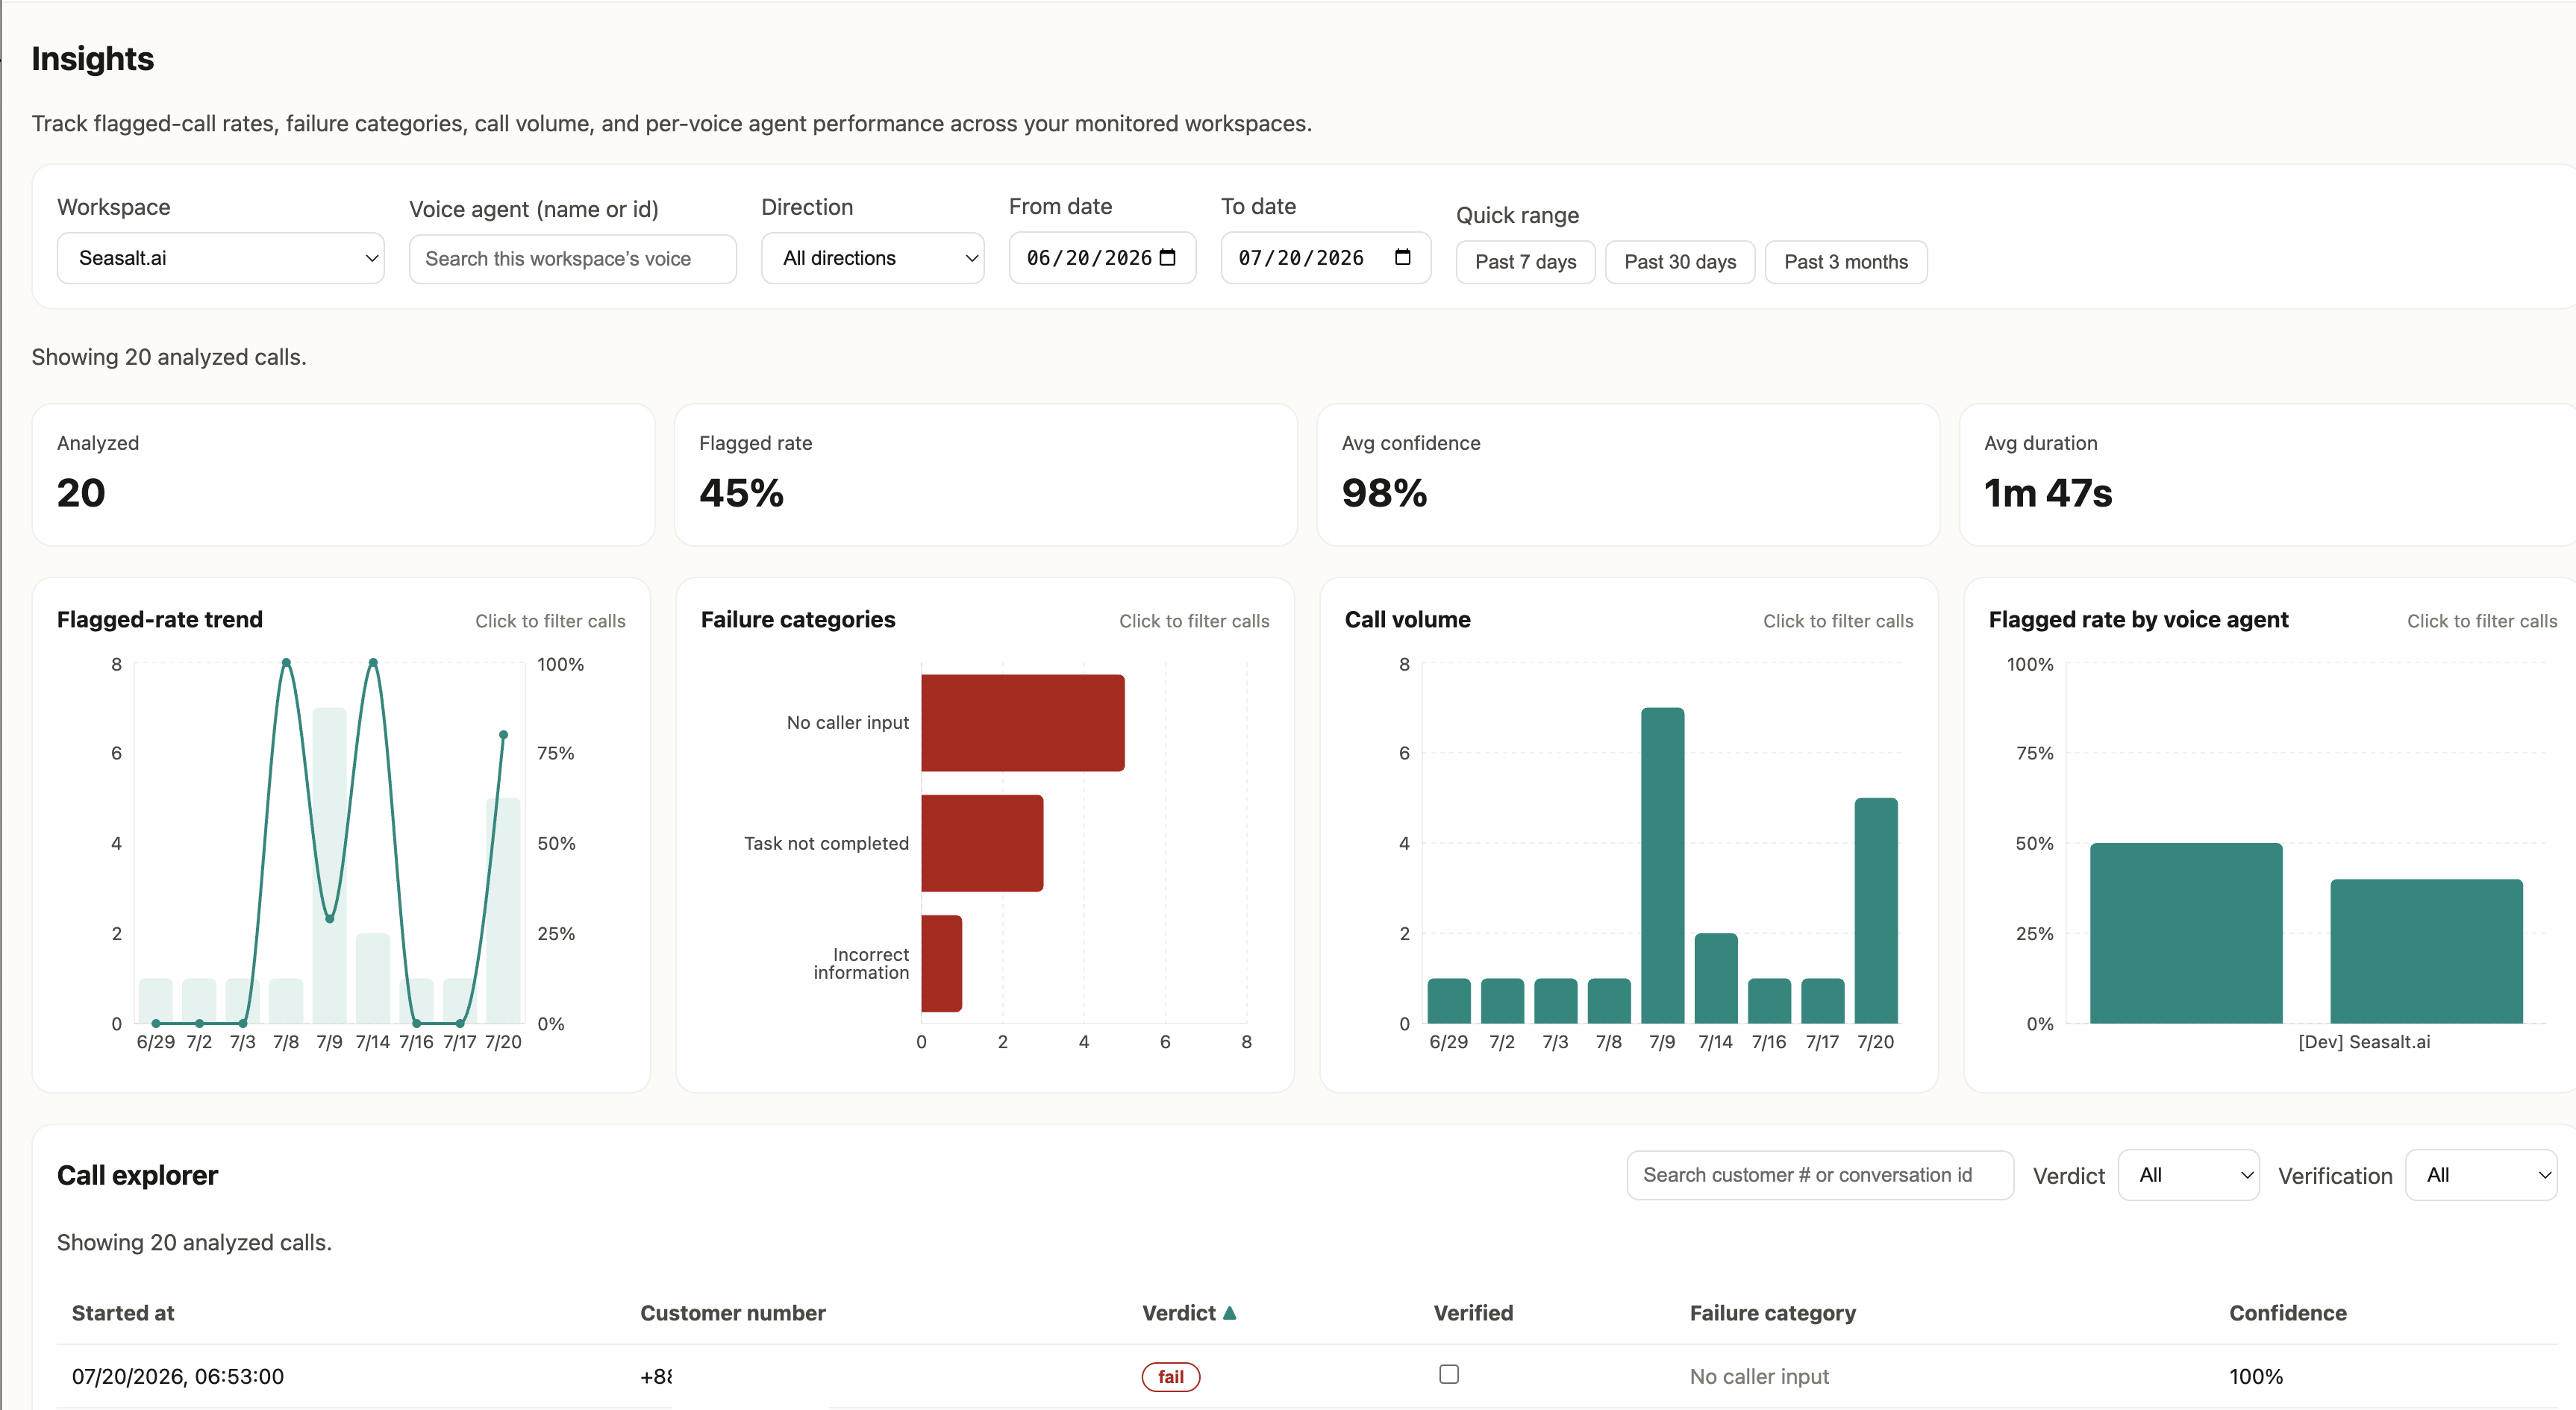
Dashboard Overview
This guide is designed to help you quickly familiarize yourself with the features and metrics of the Insights dashboard. We built this dashboard to track flagged-call rates, failure categories, call volume, and per-bot performance across your monitored workspaces, providing complete transparency into your voice campaigns (both inbound and outbound).
Rest assured, our team is constantly monitoring the execution of every single call in the background. Through this dashboard, you can track real-time progress, and we will continuously use this data to dynamically optimize the bot’s communication logic and call quality for you.
Top Filter Tools: Customize Your Scope
The control bar at the very top of the page allows you to filter data accurately by time, specific bots, or call directions:

Top Filter Tools
| Filter Field | Description | Practical Application & Tips |
|---|---|---|
| Workspace | Select the specific project group or workspace. | Ideal for clients managing multiple business lines or distinct projects. |
| Bot (name or id) | Use the dropdown to search for or specify an AI bot. | Perfect for A/B testing performance when running multiple bot versions simultaneously. |
| Direction | Filter by “Inbound”, “Outbound”, or “All directions”. | Seamlessly switch focuses between customer support (inbound) and proactive outreach (outbound). |
| From date / To date | Customize the specific date range you wish to view. | Useful for pulling data for weekly or monthly reports. |
| Quick range | Shortcuts for “Past 7 days”, “Past 30 days”, “Past 3 months”. | A handy tool for quickly assessing recent campaign trends. |
Four Core Metrics & Visualized Charts
The core health indicators and the four visualized charts are displayed in the main body of the dashboard. This comprehensive view allows you to assess the campaign’s status and trends instantly.
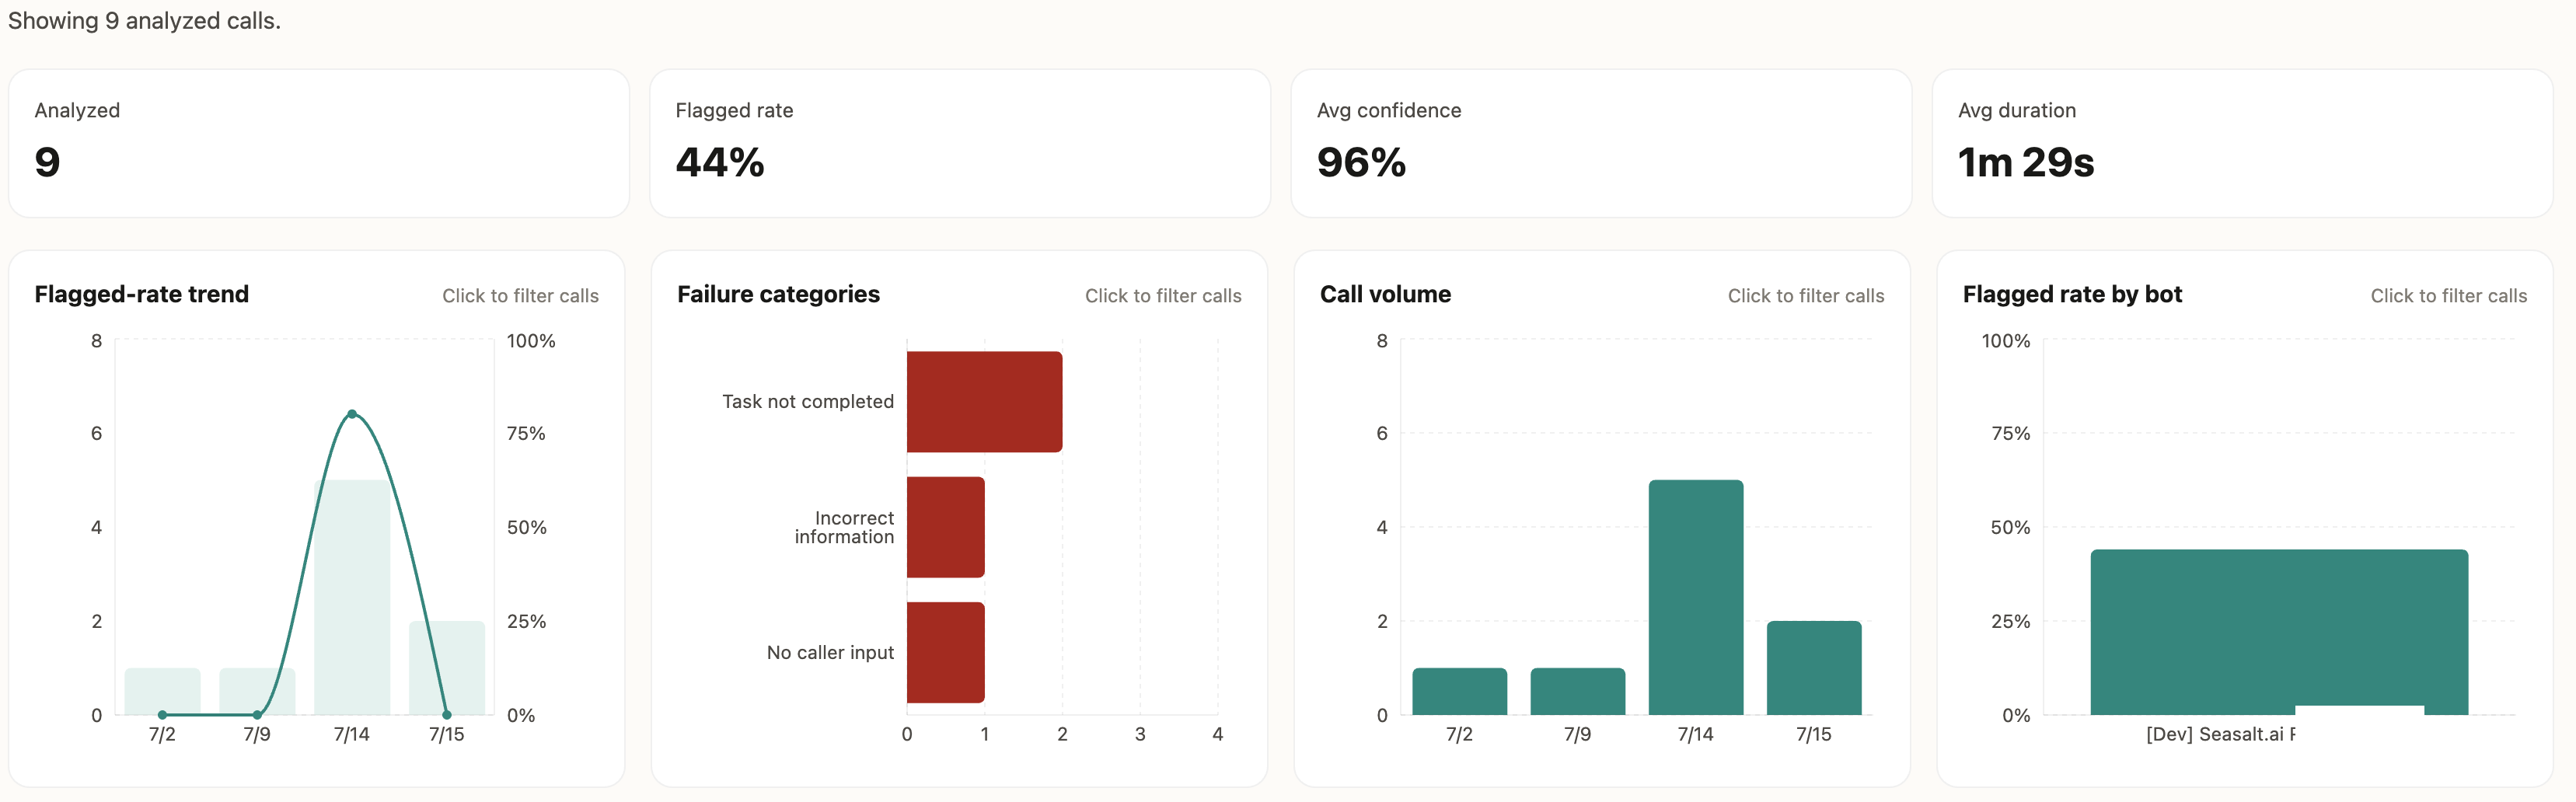
Core Metrics and Visualized Charts
Four Core Metrics: Monitor Overall Health
The four large cards represent the essential “Health Metrics” you should check every time you evaluate your campaign:
1. Analyzed
- Definition: The total number of calls successfully collected, processed, and semantically analyzed by the system.
- What it means for you: This represents the data sample size of your project. The larger the sample, the more reliable the overall trends.
2. Flagged rate
- Definition: The percentage of analyzed calls that are “problematic” or did not pass successfully.
- What it means for you: This is the critical metric for project optimization. A flagged call usually indicates a conversation that encountered an anomaly (e.g., Caller not understood, AI Agent not responding, Voicemail misdetected). If the flagged rate remains stable and low, your call flow is running smoothly.
3. Avg confidence
- Definition: The average percentage of certainty the AI speech recognition model has in understanding the customer’s intent.
- What it means for you: This is your technical quality assurance. A high average confidence (e.g., 95% - 99%) means the AI accurately and flawlessly understands customer responses. You can be completely at ease.
4. Avg duration
- Definition: The average length of a call from connection to hang-up (in seconds).
- What it means for you: Helps evaluate your script design. If the duration is too short, customers might be hanging up early; if too long, the flow might need to be streamlined.
Visualized Charts: Spot Trends & Anomalies
(Note: Please refer to the merged screenshot in the section above to view these charts on the dashboard)
The four charts in the middle section turn complex data into intuitive visual insights.
💡 Pro Tip for Interactivity:
This dashboard supports dynamic drill-downs. Notice the “Click to filter calls” hint on the charts:
- Hover for Details: When you hover your mouse over any bar or line node in the charts, a detailed tooltip will automatically pop up showing the exact value.
- Click to Filter: When you click on a specific date’s bar graph (e.g., 07/14), the “Call explorer” list at the bottom will automatically filter and switch to show only the calls from that specific date! This allows you to instantly pull up calls for verification when you spot an anomalous trend.
Flagged-rate trend
- Chart Type: Combined Bar and Line Chart.
- How to Read: The green bars represent total call volume, and the blue line shows the fluctuation of the flagged (problematic) call rate. If the line spikes on a given day, click the bar to investigate the call explorer below.
Failure categories
- Chart Type: Red Horizontal Bar Chart.
- How to Read: Lists the primary reasons why calls were flagged (e.g., Caller not understood, AI Agent not responding).
- Our Commitment: This is the core foundation for our collaborative optimization. Our team regularly analyzes these categories to adjust the bot’s scripting, trigger timing, and system settings, maximizing your connection and conversion rates.
Call volume
- Chart Type: Green Vertical Bar Chart.
- How to Read: Displays the total number of successful calls executed daily. Helps ensure the system’s processing volume aligns with your schedule.
Flagged rate by bot
- Chart Type: Comparative Bar Chart.
- How to Read: If using multiple bots, this compares their flagged rates, helping you spot which bot or version performs the most stably at a glance.
Call Explorer: Track Individual Calls
The “Call explorer” at the bottom of the page is your micro-analysis tool. Whenever you click a specific date above or want to do a random spot-check, you can review specific cases here.
💡 Pro Tip for Sorting:
All column headers in the list support custom sorting. Click a header (like the ▼ icon) to sort ascending or descending. We highly recommend sorting by “Started at” to view the newest calls, or by “Verdict” / “Confidence” to quickly identify cases requiring immediate attention.
Column descriptions:
-
Started at: The exact timestamp when the call was initiated.
-
Customer number: The masked or complete contact number of the client.
-
Verdict:
- pass: The call was successfully completed and followed the script’s success path.
- fail: The call encountered an issue midway or failed to achieve the set goal (these are the “Flagged” calls mentioned above).
-
Verified (Checkbox):

Verified Checkbox
This is a powerful tool for team collaboration and management! For “fail” cases, once you or your team have manually verified the recording and handled the issue, you can check this box and save. This mechanism allows you to centralize the management of all problematic calls requiring manual review, ensuring no case is left unresolved.
-
Failure category: Directly tags the specific reason for a flagged call (e.g.,
Voicemail misdetected), allowing you to quickly filter clients who might need follow-up care. -
Confidence: Displays the AI speech recognition confidence score (%) for that single call.
FAQ & Support
Q1: What should I do if I see a lot of flagged / “fail” calls?
Please don’t worry. A “fail” status can occur for a few different reasons. It might indicate that the call genuinely encountered an issue or didn’t reach its intended goal. However, it could also mean that the system’s evaluation criteria for determining a “pass” simply need to be fine-tuned for your specific campaign. If you notice a persistently high failure rate, please contact us! Our team will help you investigate the call details and adjust the evaluation standards to ensure accurate tracking moving forward.
Q2: Is the data updated in real-time?
Yes, the dashboard data updates in Near Real-time. After a call concludes and is analyzed, it typically appears on your dashboard within minutes.
Our Service Commitment:
This dashboard is more than a data display; it represents our commitment to guarding your campaign’s success. We don’t just process calls; we continuously monitor and learn behind the scenes using these precise metrics.
If you have any questions about the dashboard metrics or need help exporting specific data, please reach out to your dedicated support agent at any time!
Support
Need assistance? Contact us at info@seasalt.ai.